
Can the same abilities needed to grow new products be applied to evaluating startup growth to understand if you need to invest in?
Yes, the reason for this is that many of the abilities required to establish and scale a new business are similar to those required to invest in a new startup: Firstly, the conditions for customer growth, such as growth cycles, acquisition quality, engagement, attrition, and monetisation. Secondly, setting priorities and making decisions that have an impact on the future.
Of course, as an investor, you can’t actually do A/B tests or analyse outcomes, but you can develop hypotheses, brainstorm ideas, and think in the same way.
Growth Hacking
If you look at Google Trends, you’ll see that “growth hacking” all of a sudden became a term people in the industry were interested in and were searching for recently.
And these days, it’s spread and become its own ecosystem. Teams focusing on user growth have spun up across some of the best companies in the ecosystem. Of course “growth hacking” has changed a lot – it’s no longer about hacks as it’s become a more professionalised, formal function within a team.
The other evolution in the ecosystem is that people are thinking about different things – about how to build growth teams, not just hacks. Thinking about new user experience, engagement metrics, and other important concepts.
Startup growth in terms of investment
Let’s switch gears now. How might you utilise all of this talk about startup growth to evaluate new products in an investing context?
To begin, you’ll frequently come across a new startup that displays their growth curve, which may appear to be up and to the right! This is fantastic. Isn’t it time to invest?
The issue is that you have no idea where it will go. Over the course of an investment, this curve may go in a direction you don’t want it to go – it may plateau, or it may even collapse. Alternatively, you may discover that it will continue to rise, possibly even hockey-sticking.
Startup Growth accounting network
The Growth Accounting Framework is one of the frequent frameworks used to try to comprehend this.
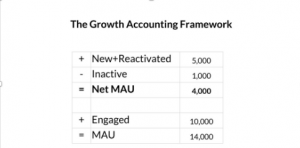
Within each time period (say, a week or a month), you’ll add some users, reactivate some users who had previously churned, and have some users go inactive. When you sum it all together, you get a product’s “Net Monthly Active Users (MAU)” – the difference between each time period.
If your positive terms (New+Reactivated) are less than your negative terms (Inactives), you will stop expanding and the whole thing will turn negative.
Let’s look at each term in isolation.
The New+Reactivated:
It has a linear or S-curve appearance. The reason for this is that scaling acquisition is extremely difficult — only a few methods, such as viral loops, paid promotion, and SEO, can get you to millions or tens of millions of users.
And as the acquisition channel grows in size, it becomes less efficient. Advertisements become more expensive to purchase, and viral loops saturate your target demographic.
Reactivation is notoriously difficult to manage. If someone abandons your product, sending them a series of emails is unlikely to help. (However, if you have a network, photo-tagging or @mentions may help!). However, because most goods lack a network, the acquisition period is typically significantly longer than the reactivation period.
Inactive
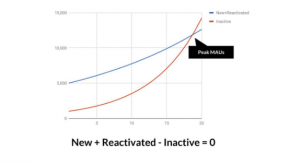
The Inactive curve is an S-curve as well, although it occurs after acquisition. You can’t really churn unless you have a base of active users. When you have no users, you can’t churn them. As a result, it rises with time. Typically, your acquisition curve will push you higher, and then churn will begin.
Each time period, when your New+Reactivated users equal your Inactive users, you reach peak MAUs. This is the point to keep an eye on because after that, it’s all flat or downhill.
In this example, I’m using MAUs, but you could use active subscribers, users who have purchased anything in the last 30 days, or any other metric. The fundamental physics are identical.
If you’ve been paying attention, you’ve already realised something significant. We’ve gone from looking at a single expanding curve and decomposing it into its underlying terms to showing how a curve that’s been heading up and to the right for a while could flatten out next month. Why?
Lagging metrics:
The issue is that trailing measures are allowed under the Growth Accounting Framework. It’s difficult to foretell the future. It’s also difficult for product teams to be actionable.
Instead, you’ll need more predictive conceptual models and leading indicators.
To do so, I recommend examining two crucial loops: acquisition loops, which power the positive term, and new engagement loops, which power the negative terms of reactivation and inactivity.
The key to solving the difficulty of forecasting where a graph will go is to understand the underlying loops.
I don’t mean that you should just use a spreadsheet to figure out how these loops work. I’m referring to the loops’ quality — how defensible and proprietary are they? How repeatable and scalable is it? Is there a benefit to optimising or expanding them further?
User Acquisition loop:

The most- important question to ask about the Acquisition Loop is how one batch of new users leads to another cohort of new users.
If you can get that going, you’ll be able to illustrate how it scales using a conceptual proof via induction.
Importantly, these loops are product flows that are built on top of massive platforms that already exist. The loops are sometimes created because they are purchased — via advertisements.
They’re sometimes constructed using API connectors to make sharing easier and faster. And sometimes it’s through a collaboration.
Fundamentally, a product like Yelp or Houzz is a UGC SEO-driven cycle. New people discover content via Google, and a small percentage of them create additional content, which is subsequently indexed by Google, and the cycle continues.
This is likewise the case with Reddit. Glassdoor is the same way. And so forth.
Paid marketing is an evident loop as well. Spend money, sell items, collect the proceeds, and buy more advertisements. Continue on.
You have a 0.8 ratio if you can persuade 1000 users to invite and sign up +800 of their friends. But that’s only in the loop’s initial cycle. However, those 800 new users generate 0.8*800=640 new users, who generate 480 new users, and so on, until the entire cohort has +1500 signups from a base of 1000.
When you have a high paid marketing spend, this is especially essential because it can lower your cost of acquisition by incorporating a scalable form of organic. It has the potential to be a big benefit.
After you’ve gathered all of this information, you should be able to build a set of scenarios for where your development curves will go. You can probably anticipate that the product and marketing teams will execute aggressively and grab all of the opportunities you saw.
Alternatively, you may assume that there is no engineering assistance required and that adding a few extra advertising channels is all that is required. To make a new curve, you can combine all of these instances. This is your prognosis. It’s a forecast for the future.
Even if you completed everything, you’d still have a significant issue. Because you just looked at half of the problem, your prediction would be inaccurate. Engagement is on the other side, with all of its loops.
Engagement loop

There’s an Engagement Loop, which is comparable to the Acquisition Loop that we looked at earlier. Let’s have a look at that.
The important question in relation to engagement is similar to the one we posed in relation to acquisition. If your product is based on a network, such as Dropbox or Slack, you’ll need active users to engage with one another. If it’s just utilitarian, you’ll want involvement in one era to help set up engagement in the future.
You get a game of ping pong in an engagement loop based on social feedback. When one user chats, follows or mentions another, they are retweeted. Then that user might do the same thing, attracting a new user. And it goes on and on.
This is why it’s critical to achieve network density and easy content creation—you need strategies to get individuals back into the network.
There are many more engagement loops than these two.
There are linear channels to re-engage people, just like there are for acquisition. Of course, these are useful, but they don’t scale. It’s preferable when users re-engage with each other or with themselves.
This is one of the reasons why marketing-driven one-time email messages are frequently unproductive. They don’t scale well, aren’t engaging for users, and can lead to churn if there are enough of them. This isn’t good.
The first is to look at everything in groups, as everyone knows. We want to know why the user cohorts are being drawn back in the first place – is there value provided at each visit that makes the product more sticky over time? Is it possible that they’re forming a network?
There are a few things to keep an eye out for:
Cohort curves must be flattened. Ideally, >20%, such that each signup becomes a persistent, engaged user over time. If only 5% of users stick around, you’ll need to sign up 2 billion people to reach 100 million MAUs. This isn’t feasible.
Notifications — whether by email, push notifications, or another on-platform channel – are one of the most important tools for closing the engagement loop. It is simple to abuse them.
Concluding forecast
Finally, the best way to think about alerts is that they help to accelerate engagement that already exists – you can’t create it out of thin air.
Some products create a lot of notifications by default, and we can now develop the forecast now that we have all the tools.
Because each cohort begins with the number of new users recruited, the previous forecast on acquisition loops may be used to slot into this.
The cohort retention curves can then be used to create curves that correspond to monthly activities or customers.
Once we know both the acquisition and engagement curves, we can forecast MAUs. If you project it out a few quarters, you may have a good idea of where MAUs will be in two years.
In comparison to Acquisition, engagement metrics are extremely difficult to change. As a result, it’s safer to take the curves at face value.
If you must include a bullish prognosis, the best approach is to concentrate on new user activation. Upselling users from one frequency segment to the next is also an option. That is the quantitative approach.
We have the acquisition loop and the engagement loop. For each, there are forecasts and some positive scenarios.
Conclusion
So, what are our options?
The Growth Accounting Framework was the catalyst for this entire blog. We have the inputs if we have a thorough understanding of both acquisition and engagement.
We can create scenarios that model the outputs using the inputs and acquire a better understanding of the dangers involved. In the end, this is about a projection that focuses on the quality of acquisition and engagement, rather than a single number in two years.
Startups aren’t designed to be like spreadsheets but we can answer important questions using the Growth Accounting Framework.